


Physical vs. Economical Occupancy in Apartment Investing
Vacancy in apartments decreases potential rental income and getting high economic occupancy is the goal. There are two different types of apartment investing:
Physical Occupancy
The physical occupancy rate is made up of the number of occupied units that have a tenant signed with a lease. This is shown on the rent roll with the tenant’s name next to the unit number which needs to be physically audited and verified by the property managers that have boots on the ground.
Often listed as a percentage. For example, a 100-unit property with 8 vacancies will have a 92% physical occupancy. Alternatively, physical vacancy is used which is the percentage of unoccupied units in a property.
However just because a unit is occupied, doesn’t mean it’s generating income (i.e. tenant may not be paying full monthly rent).
Depending on the market, full occupancy is 92-100% occupied.
Economic Occupancy
Economic occupancy accounts for the actual rent income received as related to the occupancy. It takes into account:
- Existing tenants not paying rent
- Rental concessions ($200 move-in specials, discounts to motivate tenant prospects)
The economic occupancy formula is calculated by dividing the net rent by the gross rent possible.
For example on a 100-unit apartment assume each unit rents for $1,000/month which gives a gross potential of $1,200,000/year. Let’s say you have 10 people not paying any money and 10 people paying half rent. That would give you an economic occupancy rate of 85%. Typically we assume 3% as the normal amount of non-collections. So if we have a property “fully occupied” at 95% it is normal to see 92% of the top line rents actually hit our bank account. Still, this is a lot better than a single-family home rental property where one deadbeat tenant means zero income for the property owner. This is why we like larger commercial assets because it’s a steady-state numbers game which a lot of the variability is taken out of the investment.
In Economic Occupancy, this could entail:
- Poor Property Management
- Bad rent collection (or PM stealing money)
- Lack of maintenance (causing tenants to leave)
- Great opportunity for a real estate investor with the right business plan
Note: This is a key part of real estate investing due diligence to spot-check that the syndicator has accounted for economic vacancy/loss to lease.
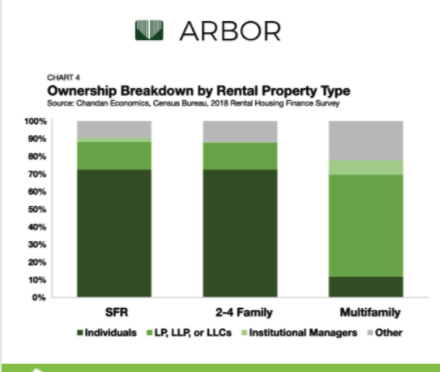
We focus on multifamily housing properties in the $10M to $50M purchase price range. We avoid smaller properties due to the competition from unsophisticated mom-and-pop investors that push up prices. We also steer clear of large institutional investors who are willing to overpay for large assets (investing lazy retirement money for the masses). We believe that the middle market, which includes real estate projects and transactions in the $20M-$100M total capitalization range, can offer a good opportunity for solid risk-adjusted returns. The middle market may be particularly attractive during a down market as there may be even less competition, and unique opportunities caused by market dislocation can be found (distressed operators).
Different Types of Deals
Below is yet another way investors discuss deal risk/reward profiles – so if you joined our inner circle or came to one of our events you would be primed to start adding value to conversations and build relationships with other pure passive investors.
The way deals are categorized below does not speak to any being “better” than each other. Of course, our eCourse will help you find sucker deals (ie Opportunistic deals that have the same projected returns as Core deals). It is up to you as an investor to develop your own personal investment philosophy based on your values and investor goals/timelines.
As with any investment opportunity, however, real estate carries risk – sophisticated investors know that assuming the deal they are looking at follows the typical Sharpe Ratio trendline that more risk you take on means more potential returns:
- Core (usually lowest risk): These are new or like new properties in highly desirable neighborhoods that are often fully rented to tenants with good credit. Since they’re in new/like new condition though, there’s little to no room to improve the property to increase cash flow. These investments are usually a good fit for investors who want stable income and capital preservation.
- Value-add (usually higher risk): These are typically good properties in decent areas that are at least partially rented and generating some cash flow, but that cash flow could be increased if the property or its management (sometimes both) is improved. Given the cash needed to fund improvements and the increased risk of execution for the business plan, these investments are riskier than core investments and therefore have a higher target level of returns.
- Opportunistic (usually highest risk): These are generally older, often neglected properties in less desirable areas that may be partially rented or vacant. They can also be development projects with no rental cash flow. In both cases, a lot of time and money is usually needed to rehab or build the property, which makes this the highest risk (but potentially highest return) investment strategy of all.
Talk it through with us
Questions on “Occupancy” as you look at real deals? Join The Wealth Elevator investor community and bring them to your onboarding call.
Join the club and book your onboarding callJoining is free.

The podcast behind this course
The Wealth Elevator Podcast
Lane's show for accredited investors on passive syndications, taxes and alternative investments. Many of the lessons in this course started as episodes.
Listen on Apple PodcastsWatch on YouTube